Some dental claim denials relate to plan facts that may be reviewed before treatment; others arise from coding, documentation, timing, or later adjudication. This guide names nine eligibility and benefits-design reasons, maps them to related fields in Dental Revenue Desk’s published scope, and preserves the limits of the available dental denial data. It does not claim that any field guarantees advance detection or prevention.
The denial statistics quoted in dental marketing are not dental data
Three numbers circulate in this market, and none of them measures dentistry. The widely repeated “24% of denials are caused by registration and eligibility” comes from Optum’s 2024 Revenue Cycle Denials Index, whose stated method is an internal analysis of approximately 124 million hospital claim remits from more than 1,400 US hospitals — institutional inpatient and outpatient claims, calendar year 2023. The “12 percent of claims were denied in 2023” line in the 2024 CAQH Index is not CAQH’s own measurement either: its endnote for that sentence reads “The Optum 2024 Revenue Cycle Denials Index,” so it is the same hospital figure, re-cited. And KFF’s headline marketplace analysis — 19% of in-network claims denied in 2024 — states its exclusion in the methodology: it “includes insurers with more than 1,000 claims submitted and excludes stand-alone dental plans and small group (SHOP) plans.” Dental was removed from that dataset by design.
One government file does report dental denials, and it is the one this market’s statistics leave out. The CMS Transparency in Coverage Public Use File carries a separate sheet for individual-market stand-alone dental plans; the PY2026 file contains plan-year 2024 data. CMS publishes the underlying claim and reason counts on that sheet but no rates or shares; every rate and share below is Dental Revenue Desk’s own total from the file, computed under KFF’s published issuer filter — issuers reporting more than 1,000 in-network claims, non-suppressed denial counts — so the two analyses are comparable.
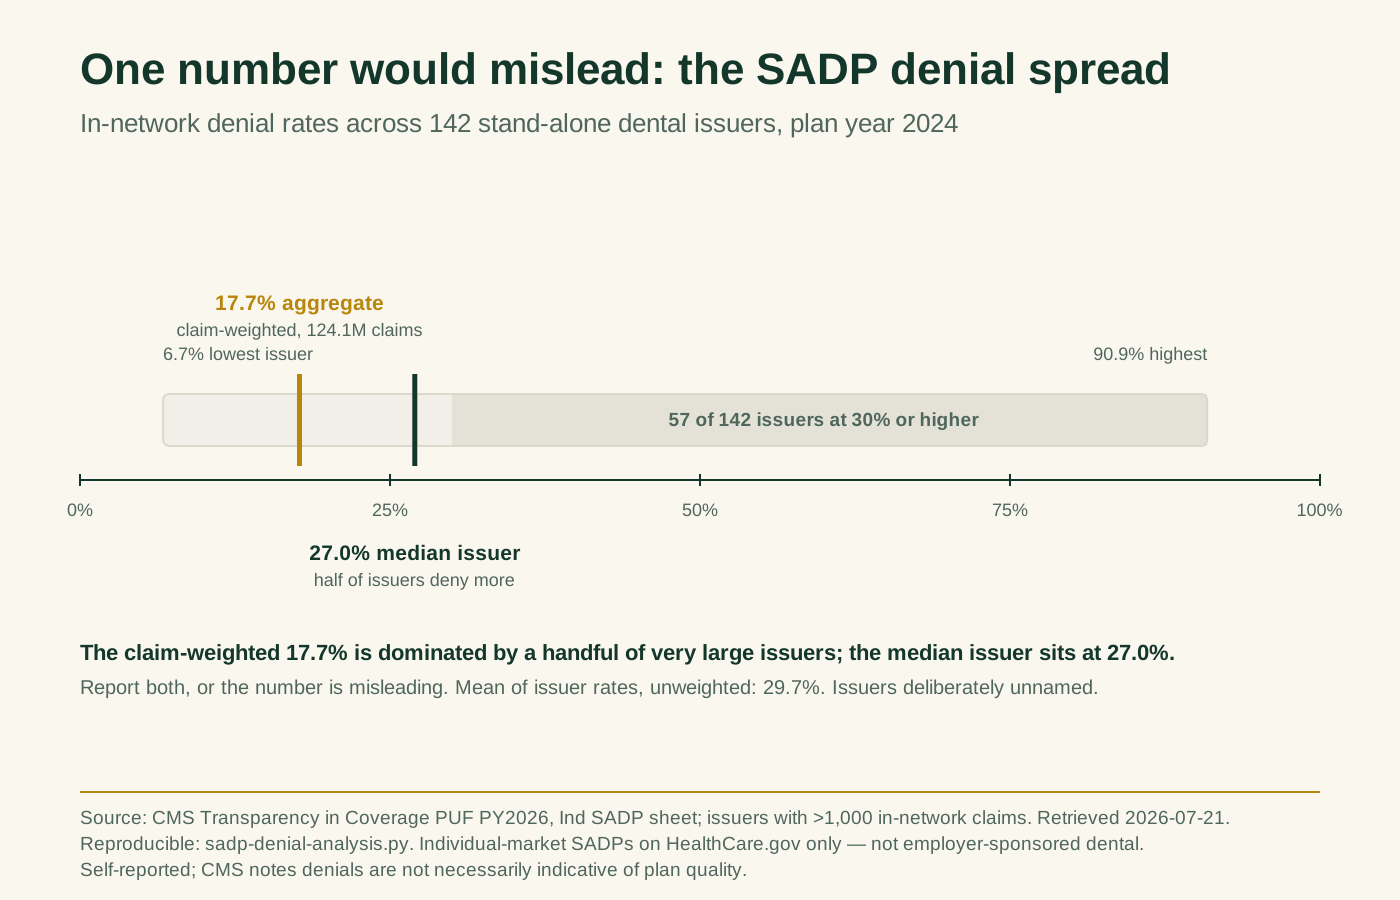
Across the 142 stand-alone dental issuers that clear that filter, 21,995,486 of 124,140,282 in-network claims were denied in plan year 2024: a claim-weighted 17.7%. That single number is misleading on its own, because it is dominated by a handful of very large issuers. The median issuer denied 27.0%, the unweighted mean of issuer rates is 29.7%, 57 of the 142 issuers reported 30% or higher, and the range runs from 6.7% to 90.9%. Both the aggregate and the median belong in any honest sentence about this data.
Five caveats travel with those figures:
- The population is one market segment. Individual-market stand-alone dental plans sold on HealthCare.gov — not employer-sponsored dental, which carries a different mix of carriers and plan designs.
- The data is self-reported. CMS’s own disclaimer reads “All issuer and plan level claims data is self-reported by QHP issuers to CMS,” and adds that “Claims denials are not necessarily indicative of issuer strength or plan quality.”
- Aggregate and median must be reported together. 17.7% and 27.0% describe the same file; quoting either alone misstates it.
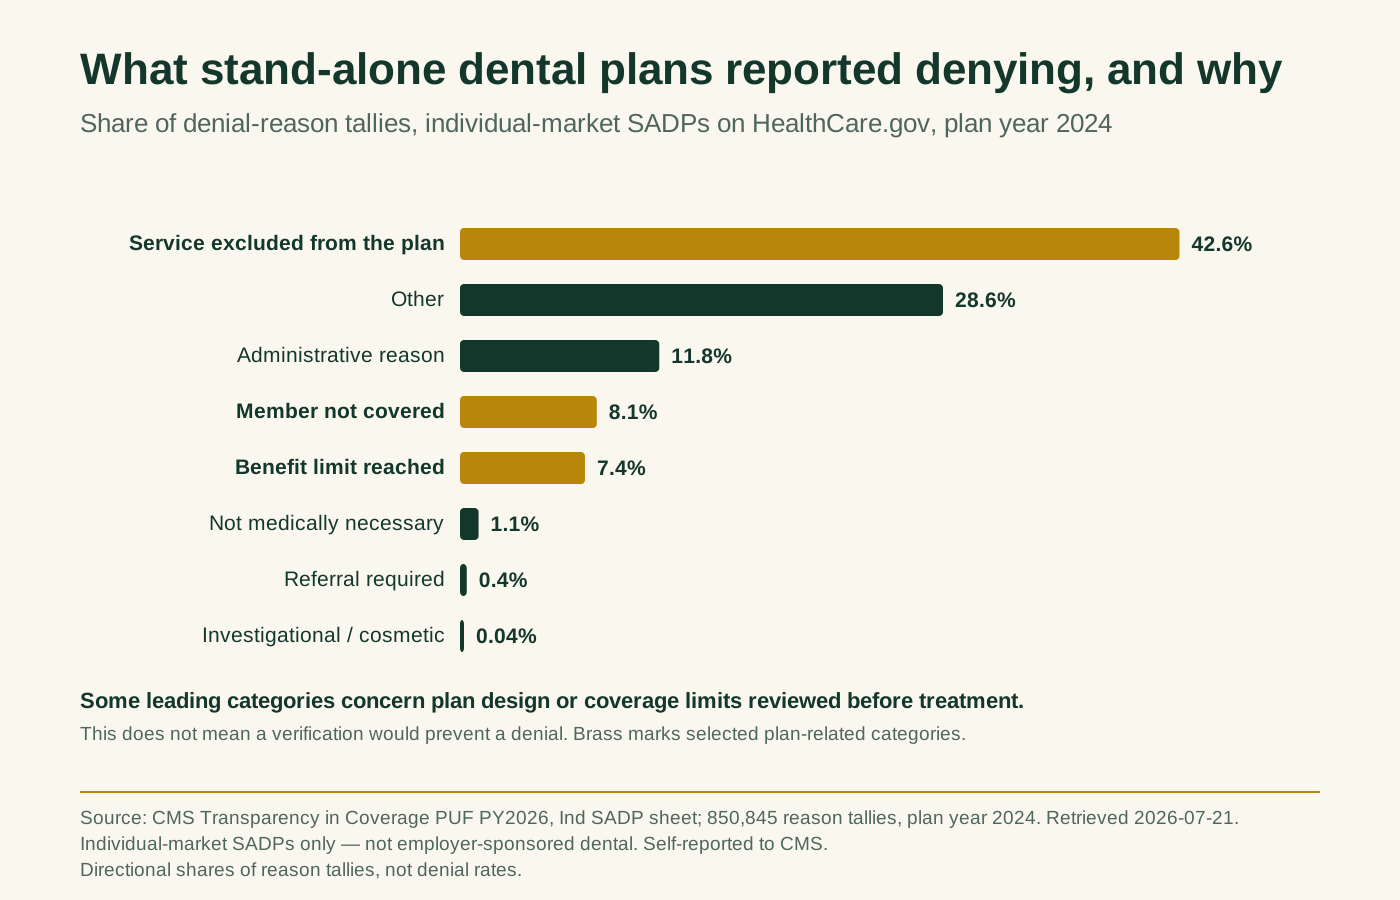
- The reason split is directional, not a rate. It is a Dental Revenue Desk total across 850,845 plan-level reason tallies against roughly 22 million denials — a share of tallies, not a CMS-published statistic — and small cells are suppressed.
- A reason is tallied per denial event. One claim can be denied more than once, so these are not shares of denied claims — and claims that were denied, resubmitted and then paid are not counted as denied at all.
Dental Revenue Desk has found no national dental claim-denial benchmark, and publishes no denial rate of its own.
Two families of dental claim denial: eligibility and benefits design, or claim construction
Denials do not arrive from one place. The ADA’s “Responding to Claim Rejections”, published by its Council on Dental Benefit Programs, opens with the plain version: “Dental claims can be denied, delayed or alternate benefited for a myriad of reasons.” Sorting that myriad by when the answer became knowable is what makes it actionable, and it splits cleanly in two.
The eligibility and benefits-design family turns on the plan itself: who is covered, until when, under what limits, and which procedures the plan agreed to benefit. Those terms may exist before treatment, but availability, accuracy, and timing can vary. This guide maps nine reasons to related fields without treating the mapping as a guaranteed finding.
The claim-construction family turns on the claim document: the wrong CDT version for the date of service, a procedure code that needed a narrative and did not carry one, a missing radiograph, bundling, downcoding, dental-necessity review, a missing required authorization, or a timely-filing issue. Dental Revenue Desk lists claims-related expansion services, but their methods, boundaries, and outcomes are not published.
One more boundary, stated plainly: this guide is written for the practice, not for a patient appealing a denial of their own. The questions it answers are which plan facts to pin down before treatment, and which field pins each one down.
| Denial reason | The plan provision behind it | The breakdown field that surfaces it |
|---|---|---|
| 1. Coverage not active on the date of service | Enrollment started later, or ended, relative to the appointment | Active status; effective and termination dates |
| 2. Wrong subscriber, member or dependent | Who the plan covers, and under which identifier | Member, subscriber and group IDs; subscriber vs dependent |
| 3. Coordination of benefits not resolved | Which of two plans pays first, and by which method | Coordination of benefits; primary vs secondary ordering |
| 4. Annual or lifetime maximum reached | A ceiling on what the plan pays in a benefit period | Annual maximum and remaining maximum; orthodontic lifetime maximum |
| 5. Waiting period not met | A time gate on a benefit category, counted from enrollment | Waiting periods; effective dates; plan year vs calendar year |
| 6. Frequency limitation exceeded | A required interval between payable occurrences of a procedure | Frequency limitations; treatment history where available |
| 7. Age limit or missing-tooth clause applied | Coverage restricted by patient age, or by a tooth missing before enrollment | Age limits; missing-tooth clause; replacement limitations |
| 8. Service excluded from the plan | A procedure the plan does not benefit at all | Non-covered services; coverage by procedure category |
| 9. Alternate benefit or LEAT applied | The plan benefits the least expensive treatment option instead | Alternate benefit / LEAT; downgrades |
Denial reasons 1–3: coverage not active, the wrong member, and unresolved coordination of benefits
1. Coverage was not active on the date of service. A claim can fail if the enrollment record does not cover the day treatment occurred. Coverage can end with employment or dependent status and can be reflected retroactively. In the CMS stand-alone dental sheet, “member not covered” is 8.1% of the reason tallies totalled above. Related published fields are active status plus effective and termination dates; Dental Revenue Desk has not published its exact appointment-date comparison or date-of-service recheck method.
2. The subscriber, member or dependent was wrong. A spouse’s card, prior-employer group number, or mismatch between a claim and enrollment record can produce a coverage problem. Related published fields are member, subscriber, and group IDs plus subscriber-versus-dependent relationship. The source-priority and identity-matching method are not published.
3. Coordination of benefits was not resolved. When a patient is entitled to benefits under more than one plan, the order is set by rule. The ADA states it directly: “When both plans have COB provisions, the plan in which the patient is enrolled as an employee or as the main policyholder is primary. The plan in which the patient is enrolled as a dependent would be secondary,” and for children of parents with overlapping coverage “the parent whose birthday is earlier in the calendar year is primary.” Filing against the wrong plan first stalls the sequence, because “usually, the secondary policy will not accept a claim until after the primary claim is paid, and then the secondary policy will often require a copy of the EOB.” The field is coordination of benefits, recorded with the primary vs secondary ordering — the mechanics, the birthday rule and the four coordination methods are set out in COB denials, in detail.
Denial reasons 4–6: the maximum is spent, the waiting period has not run, the frequency interval has not elapsed
4. The annual or lifetime maximum was already reached. A plan can be active while a benefit limit affects payment. The ADA notes that plans can carry annual or lifetime limitations, and “enrollee benefit limit reached” is 7.4% of the CMS reason tallies above. Dental Revenue Desk names annual maximum, remaining maximum, and orthodontic lifetime maximum in its published scope; it does not promise that every payer confirms each value or that the value cannot change before adjudication.
5. A waiting period had not run, or the effective date had not arrived. A waiting period gates a benefit category, not the plan: the patient is enrolled, the card works, and major services are simply not payable yet. The ADA describes the related pre-existing-condition rule and its offset — “if a plan imposes pre-existing condition exclusions, the length of the exclusion must be reduced by the amount of any prior creditable coverage,” evidenced by a certificate of creditable coverage, with a break of “63 days or more” potentially disqualifying the earlier coverage. Three dates have to be tested against each other before an estimate is honest: enrollment, the waiting period length, and the appointment. The fields are waiting periods and effective dates, and how effective and termination dates are confirmed covers the coverage window in full.
6. A frequency limitation was exceeded. Frequency limits produce denials from a calendar rather than from a clinical fact. The ADA’s example is exact: “cleanings and examinations are commonly covered twice in a plan-year or every six months. If the coverage is based on every six months, the patient will have to wait exactly six months to the date to have the second cleaning and exam provided or else it will be denied.” Bundling interacts with this — several radiographs recoded as a full-mouth series then fall under the FMX interval, “many plans will only pay for one full mouth series of radiographs in a five-year period.” Knowing the rule is half the field; the other half is the patient’s standing under it, which is why frequency and age-limit denials treats frequency limitations and treatment history as one lookup.
Denial reasons 7–9: age limits and missing teeth, excluded services, and the alternate benefit
7. An age limit or the missing-tooth clause applied. Plans define ages, and the definitions decide payment. The ADA’s worked example: a patient “is age 13 with predominantly adult dentition and you report D1110. The payer says to report D1120 for reimbursement because the benefit plan says an adult is age 15 or more” — the plan’s age definition, not the dentition, drove the outcome. The missing-tooth clause is the same shape applied to history rather than age: “some group health plans restrict coverage for dental conditions present before an individual’s enrollment in the plan, such as missing teeth. No coverage is allowed for replacing a tooth that was missing prior to the effective date of coverage.” A bridge or implant planned for a long-absent tooth is a denial that was decided at enrollment. The fields are age limits, the missing-tooth clause and replacement limitations.
8. The service is excluded from the plan. An exclusion is not a judgment about the treatment; it is a line the plan purchaser drew. The ADA is explicit that “many dental plans do not provide coverage for all dental procedures; however, this does not mean that the treatments were not necessary,” and gives the example: “implants are commonly found as exclusions in many dental plans.” This is also the single largest named category in the CMS stand-alone dental sheet — a service excluded from the plan is 42.6% of those reason tallies, against 1.1% for medical necessity. Plan design outweighs clinical dispute by a wide margin in that reporting. The field is non-covered services, read alongside coverage by procedure category.
9. An alternate benefit or LEAT provision applied. The plan pays, but it pays for something else. The ADA defines the provision as “a limitation found in many plans which reduces benefits to the least expensive of other possible treatment options as determined by the benefit plan, even when the dentist determines that a particular treatment is in the patient’s best interest,” and illustrates it: “the dentist may recommend a fixed bridge, but the plan may allow reimbursement only for a removable partial denture.” Practices meet this as a payment far below the estimate rather than a flat denial, and patients meet it as a balance nobody warned them about. Downcoding and bundling produce a similar gap from the claim-construction side and are worked there. The verification field is the alternate benefit / LEAT provision, and what a plan excludes, and what it substitutes instead covers both provisions in depth.
Why active-coverage confirmation alone does not prevent these
An active-coverage “yes” does not by itself establish a remaining maximum, waiting period, frequency interval, age definition, exclusion, alternate benefit provision, coordination order, or dependent match. Those are separate plan facts the estimate still needs.
The nearest quantified comparison is hospital data and must remain labelled that way. Optum’s index — 124 million hospital claim remits from more than 1,400 US hospitals, calendar year 2023 — splits registration-and-eligibility denials into coordination of benefits 50%, benefit maximum 27%, plan coverage 17%, and patient eligibility 6%. That distribution shows why benefits design matters in that hospital population; it does not prove that a Dental Revenue Desk breakdown detects or prevents those outcomes in dentistry.
Dental practices say the same thing about the automated route in their own words. The 2024 CAQH Index records a dental practice’s verbatim comment — “When it comes to eligibility and benefits, I don’t have an automated tool that I can trust, so I don’t use it” — and the ADA’s Council on Dental Benefit Programs chair, Mark A. Moats, D.M.D., told ADA News in March 2025 that “providers indicated in the CAQH Index that they often do not obtain robust enough information through the automated transaction to be reliable.” A 271 can carry eligibility and benefit information; the actual content varies by payer, product, request, and connection. Dental Revenue Desk’s 30-field breakdown is its service scope, not a universal ceiling on the transaction.
The denials that still happen: verification is not a guarantee of payment
Verification can inform a practice’s review, but Dental Revenue Desk publishes no measured denial-prevention result. CMS states the limit directly: an eligibility response does not guarantee reimbursement when a claim is submitted. Adjudication happens later, and relevant facts can change between an advance check and the date of service.
The claim-construction family remains separate. ADA guidance explains that dental-necessity review is based on the submitted claim and documentation and that a denial does not mean treatment was unnecessary. Coding, narratives, attachments, and timely filing carry their own risks regardless of the benefits data. Why verification is not a promise of payment covers that boundary.
Dental Revenue Desk’s published scope — not a prevention result
Dental Revenue Desk’s owner-approved scope covers every scheduled insured patient, a 30-field benefits breakdown, a 3–5-day completion target, owner-authorized write-back, and a generic exception report. Those are scope and target statements. They do not establish source priority, exception triggers, a live report schema, or a denial-prevention outcome. Review the published fields and evidence boundary.
Dental Revenue Desk also lists claim submission, attachments and narratives, and denial management as expansion services. Their inclusion, methods, authority, outputs, pricing, and responsibility boundaries are not published. The claims page states those open terms without inventing a workflow.
Dental Revenue Desk publishes no operating statistics: no denial-reduction percentage, accuracy rate, or client outcome. It publishes the field list, completion target, source limitations, and the CMS-derived stand-alone-dental analysis above.